


This article originally appeared on STR. It has been republished here with permission.
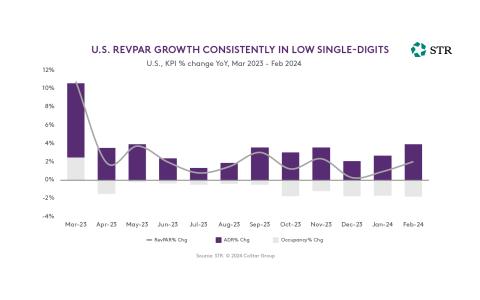
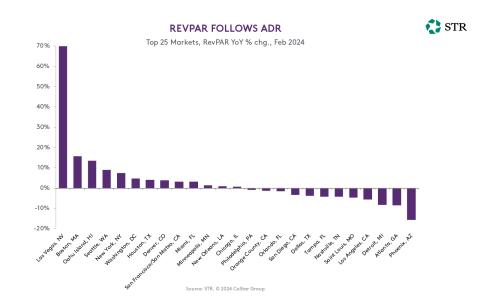
Revenue per available room (RevPAR) improved 2.0% year over year (YoY) in February, reflecting the continued return to pre-COVID patterns of low single-digit gains. Remove Las Vegas from the equation, however, and February RevPAR was down 1.4% YoY. The overall RevPAR increase was due to a solid YoY increase (+3.9%) in average daily rate (ADR), which was partially offset by an occupancy decline of 1.1 percentage points to 58.9%.
Demand across the U.S. declined for the 11th consecutive month. Supply has continued to grow modestly and is expected to remain low for the rest of the year. Furthermore, projects in the planning phase of the pipeline are rising rapidly, which will put more pressure on occupancy in the coming years. As a medium-term offset, inbound international travel is expected to increase significantly in 2024 and 2025, surpassing pre-pandemic levels in 2025 and alleviating some of the pressure.
The ADR increase came in above the rate of inflation for the first time since November 2023. Growth was spread across all elements of the week (weekdays, weekend, and shoulder days), each producing gains of at least 3.6% YoY.
February 2024 YoY Metrics:
- Occupancy: 58.9% (-1.8%)
- ADR: US$158.23 (+3.9%)
- RevPAR: US$93.19 (+2.0%)
Chain Scales
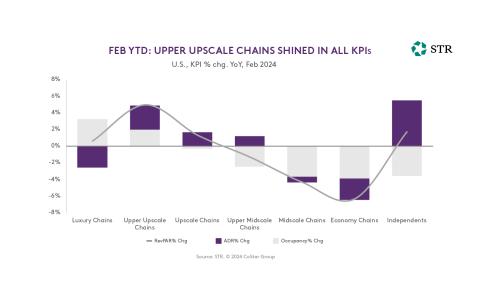
The three highest chain scales (Luxury, Upper Upscale and Upscale) posted RevPAR increases, with Upper Upscale seeing the largest gain of 4.7%. The other two scales were below +1%.
Segmentation
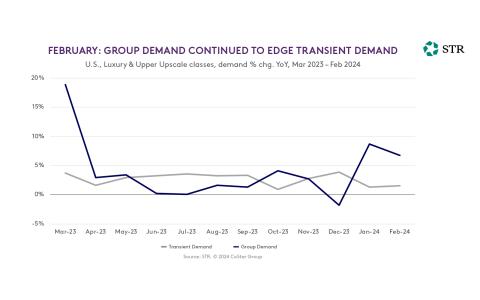
For hotels in Luxury and Upper Upscale classes, improving group demand has been a major story continuing into 2024 with YoY increases of 8.7% in January and 6.7% in February. Further, every week in January showed an improvement over the same week a year earlier. Transient demand has shown minimal increases since the start of 2024.
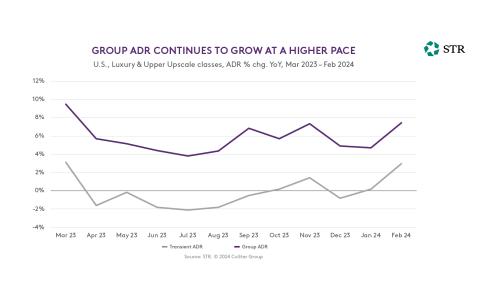
Group ADR has continued to recover throughout 2023 and into 2024, including a 4.5% YoY increase in January and an impressive 7.5% gain in February. In comparison, transient ADR stayed well below the annual rate of inflation at +1.3% and +1.6% in January and February, respectively.
Markets
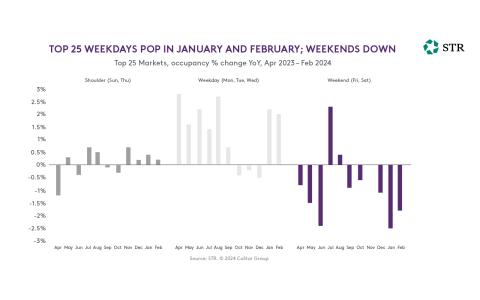
Demand growth in the Top 25 Markets continued after stalling in the last three months of 2023. Weekday demand, especially, bolstered the Top 25 Markets in February, contributing to a modest 2.0% occupancy gain. Occupancy for shoulder days (Sunday, Thursday) was basically flat (+0.2%), while weekends sustained a decline of 1.8%. In the remaining markets, occupancy was down 2.9% YoY.
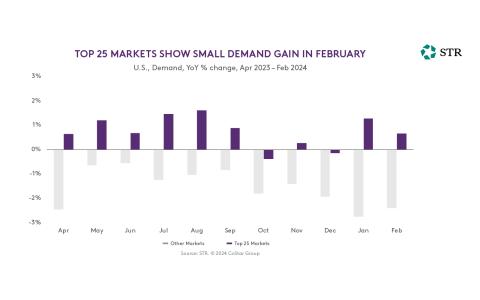
The Top 25 continued to significantly outperform other markets, and February’s ADR growth in the major markets was the strongest since the end of first quarter 2023.
Pipeline
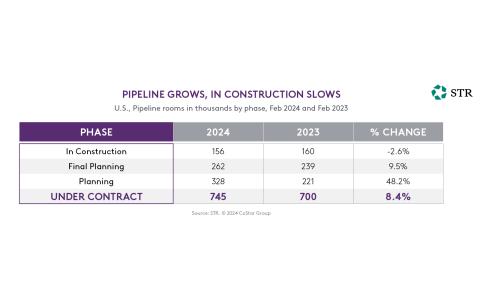
The number of rooms under construction decreased year over year for the second month in a row. Looking back on the last five-plus years, December construction activity has always been low due to some projects in construction finishing up, while new projects postpone breaking ground until after the holidays. Over the past 12 months, the number of rooms under construction has continued to trail the comparables from the previous year.
Overall, more than 745,000 rooms (6,338 hotels) sit in the pipeline with rooms up 19.3% from last year. With the Federal Reserve announcement of three quarter-percentage point cuts by the end of 2024 (first reductions since 2020), this may affect the pace at which projects break ground.
March 2024 Data
March 10-16 2024, U.S. hotel RevPAR dipped for a second consecutive week and by the worst percentage (-3.5%) since the last week of 2023. Sixty percent of the decline came from ADR, which was down 2.1%.
About STR
STR provides premium data benchmarking, analytics and marketplace insights for the global hospitality industry. Founded in 1985, STR maintains a presence in 15 countries with a North American headquarters in Hendersonville, Tennessee, an international headquarters in London, and an Asia Pacific headquarters in Singapore.
STR was acquired in October 2019 by CoStar Group, Inc. (NASDAQ: CSGP), a leading provider of online real estate marketplaces, information and analytics in the commercial and residential property markets. For more information, please visit str.com and costargroup.com.
Interested in additional insights about the 2024 hospitality market? Check out our April/May 2024 BID Magazine: a special edition all about hospitality assets. Download your free digital copy here!