


This article originally appeared on STR. It has been republished here with permission.
Top-Line Metrics (December 2024 vs. December 2023):
- Occupancy: 53.2% (+1.1%)
- Average daily rate (ADR): US$156.67 (+3.3%)
- Revenue per available room (RevPAR): US$83.30 (+4.4%)
Key Points
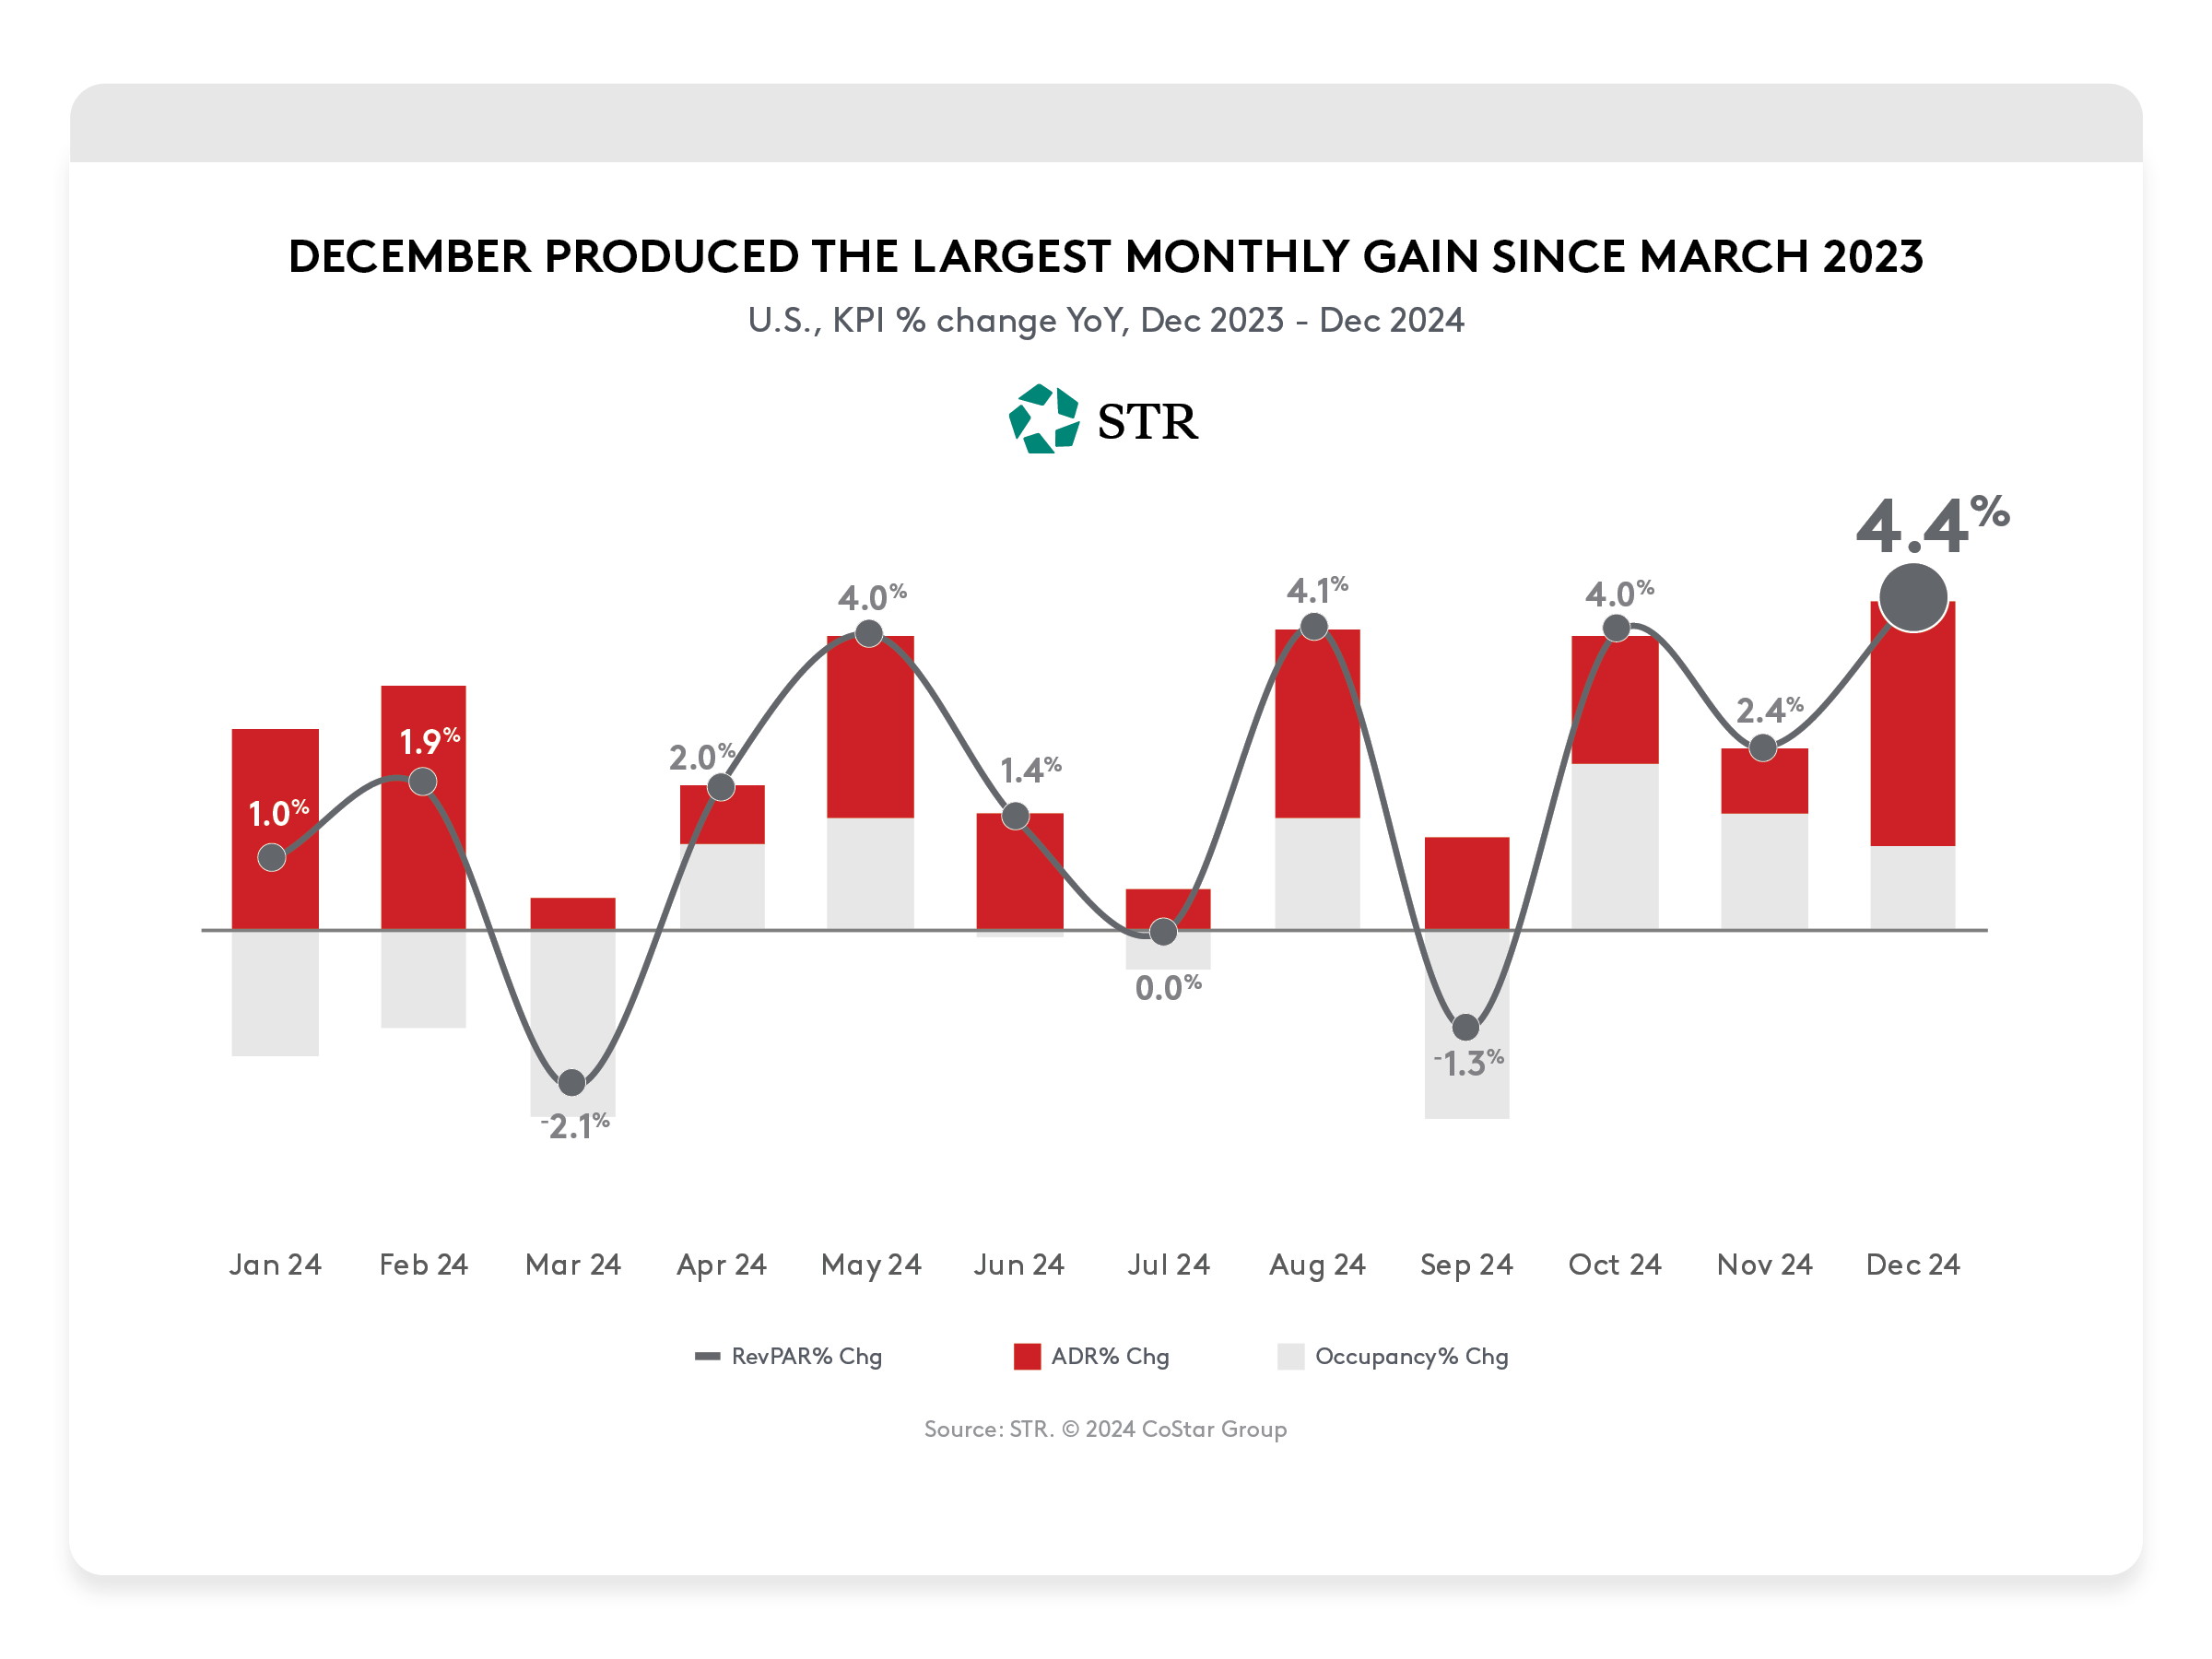
- Largest monthly RevPAR gain of the year
- Highest quarterly RevPAR growth since Q1 2023
- 13 hurricane-affected markets lifted quarterly performance
- Compressed holiday period and calendar shift also key in December performance
December capped off a strong Q4
December RevPAR was up 4.4%, which was the country’s largest year-over-year (YoY) gain since March 2023. That elevated growth was attributable to a compressed holiday season as well as the lingering effects of two major hurricanes in the fall. Two of the four full weeks in December produced double-digit RevPAR gains.
Average daily rate (ADR) surpassed inflation for the first time since February 2024, while occupancy increased 0.6 percentage points (ppts). Group demand increased 5.0%, also benefiting from the compressed holiday season, while Transient demand increased 2.0%.
Between October and December, RevPAR increased 3.6%, representing the largest quarterly gain since Q1 2023. That increase was driven fairly equally by ADR (+1.9%) and occupancy (+1.0 ppts). Room demand rose each of the three months in the quarter. Linger hurricane displacement demand as well as the calendar shift of the Jewish observances from September to October factored heavily into YoY growth.
Yearly gains
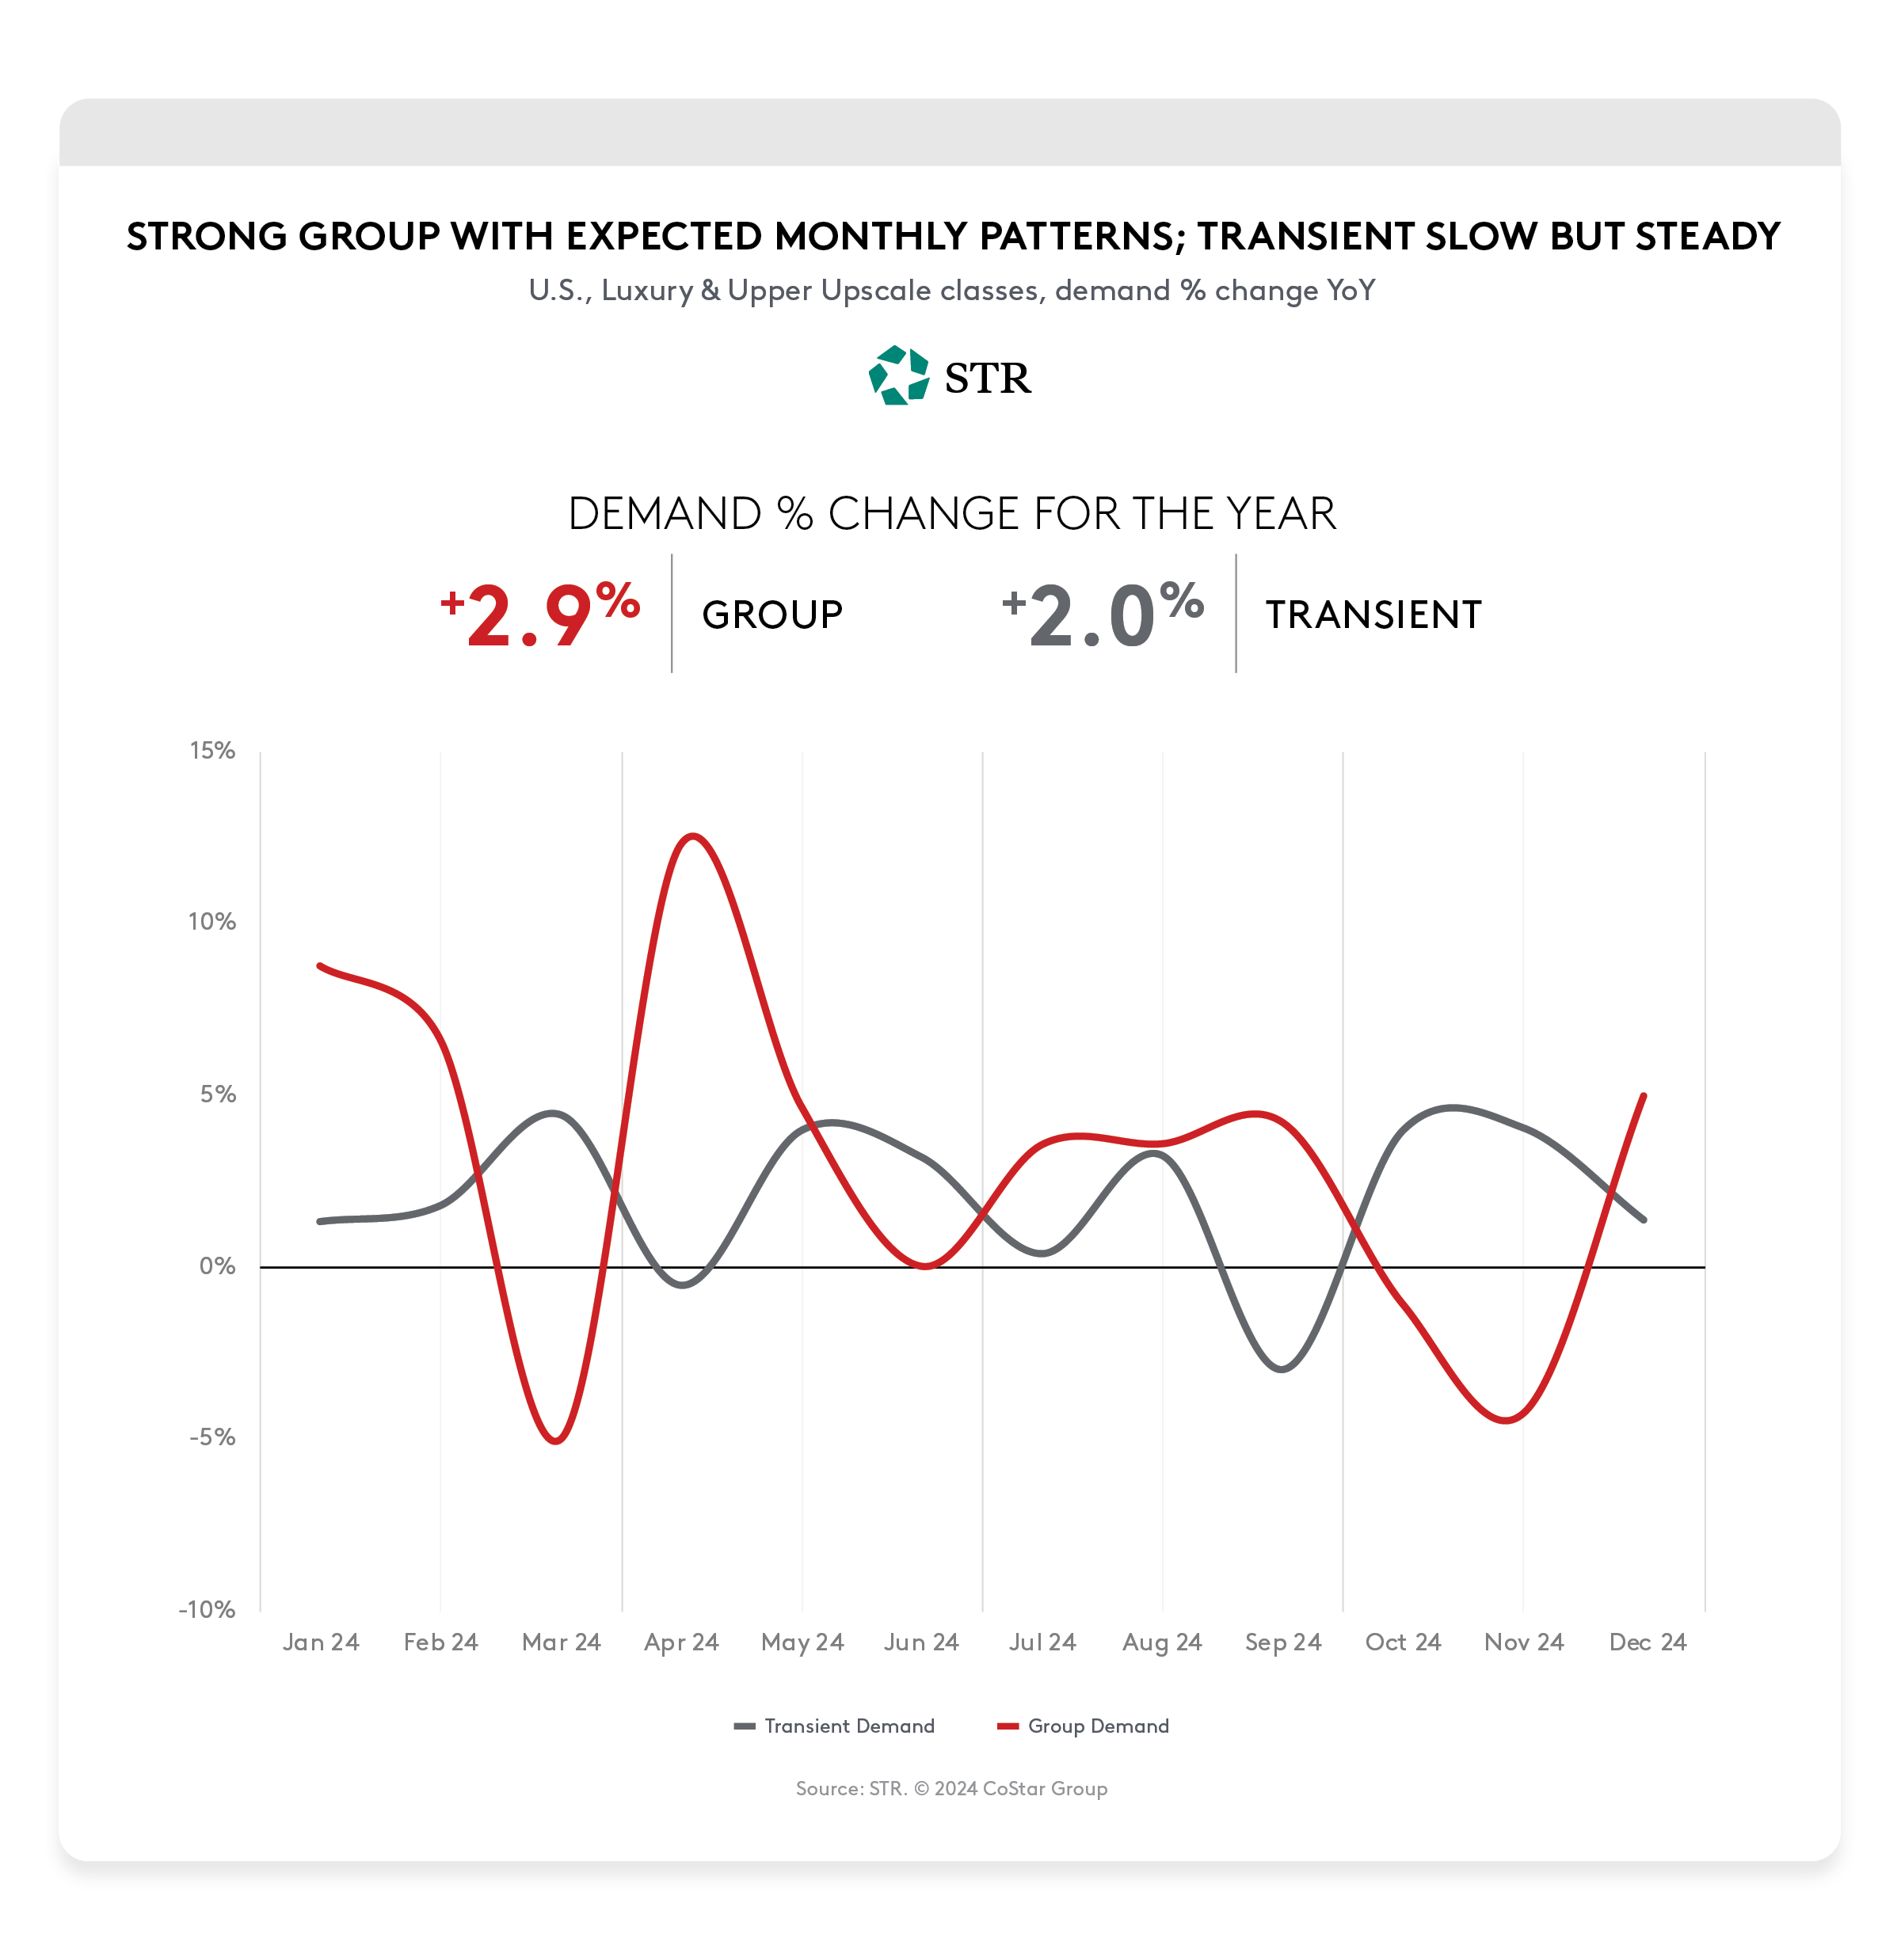
For the year, U.S. RevPAR increased 1.8%, all on ADR (+1.7%). When adjusted for inflation (2.9%), real ADR compared to 2019 was down 1.7% after coming in at -0.5% a year ago. The first half of 2024 showed an ADR increase of 1.8% while inflation hit 3.2%. During the second half of 2024, ADR increased 1.6% as inflation slowed slightly to 2.7%. The Top 25 Markets produced the strongest performance with RevPAR increasing 2.7%, while the rest of country was increased 0.9% YoY. Group demand ended the year up 2.9% compared to Transient increasing 2.0%. Pricing power was with group as ADR rose 3.5% while Transient was flat.
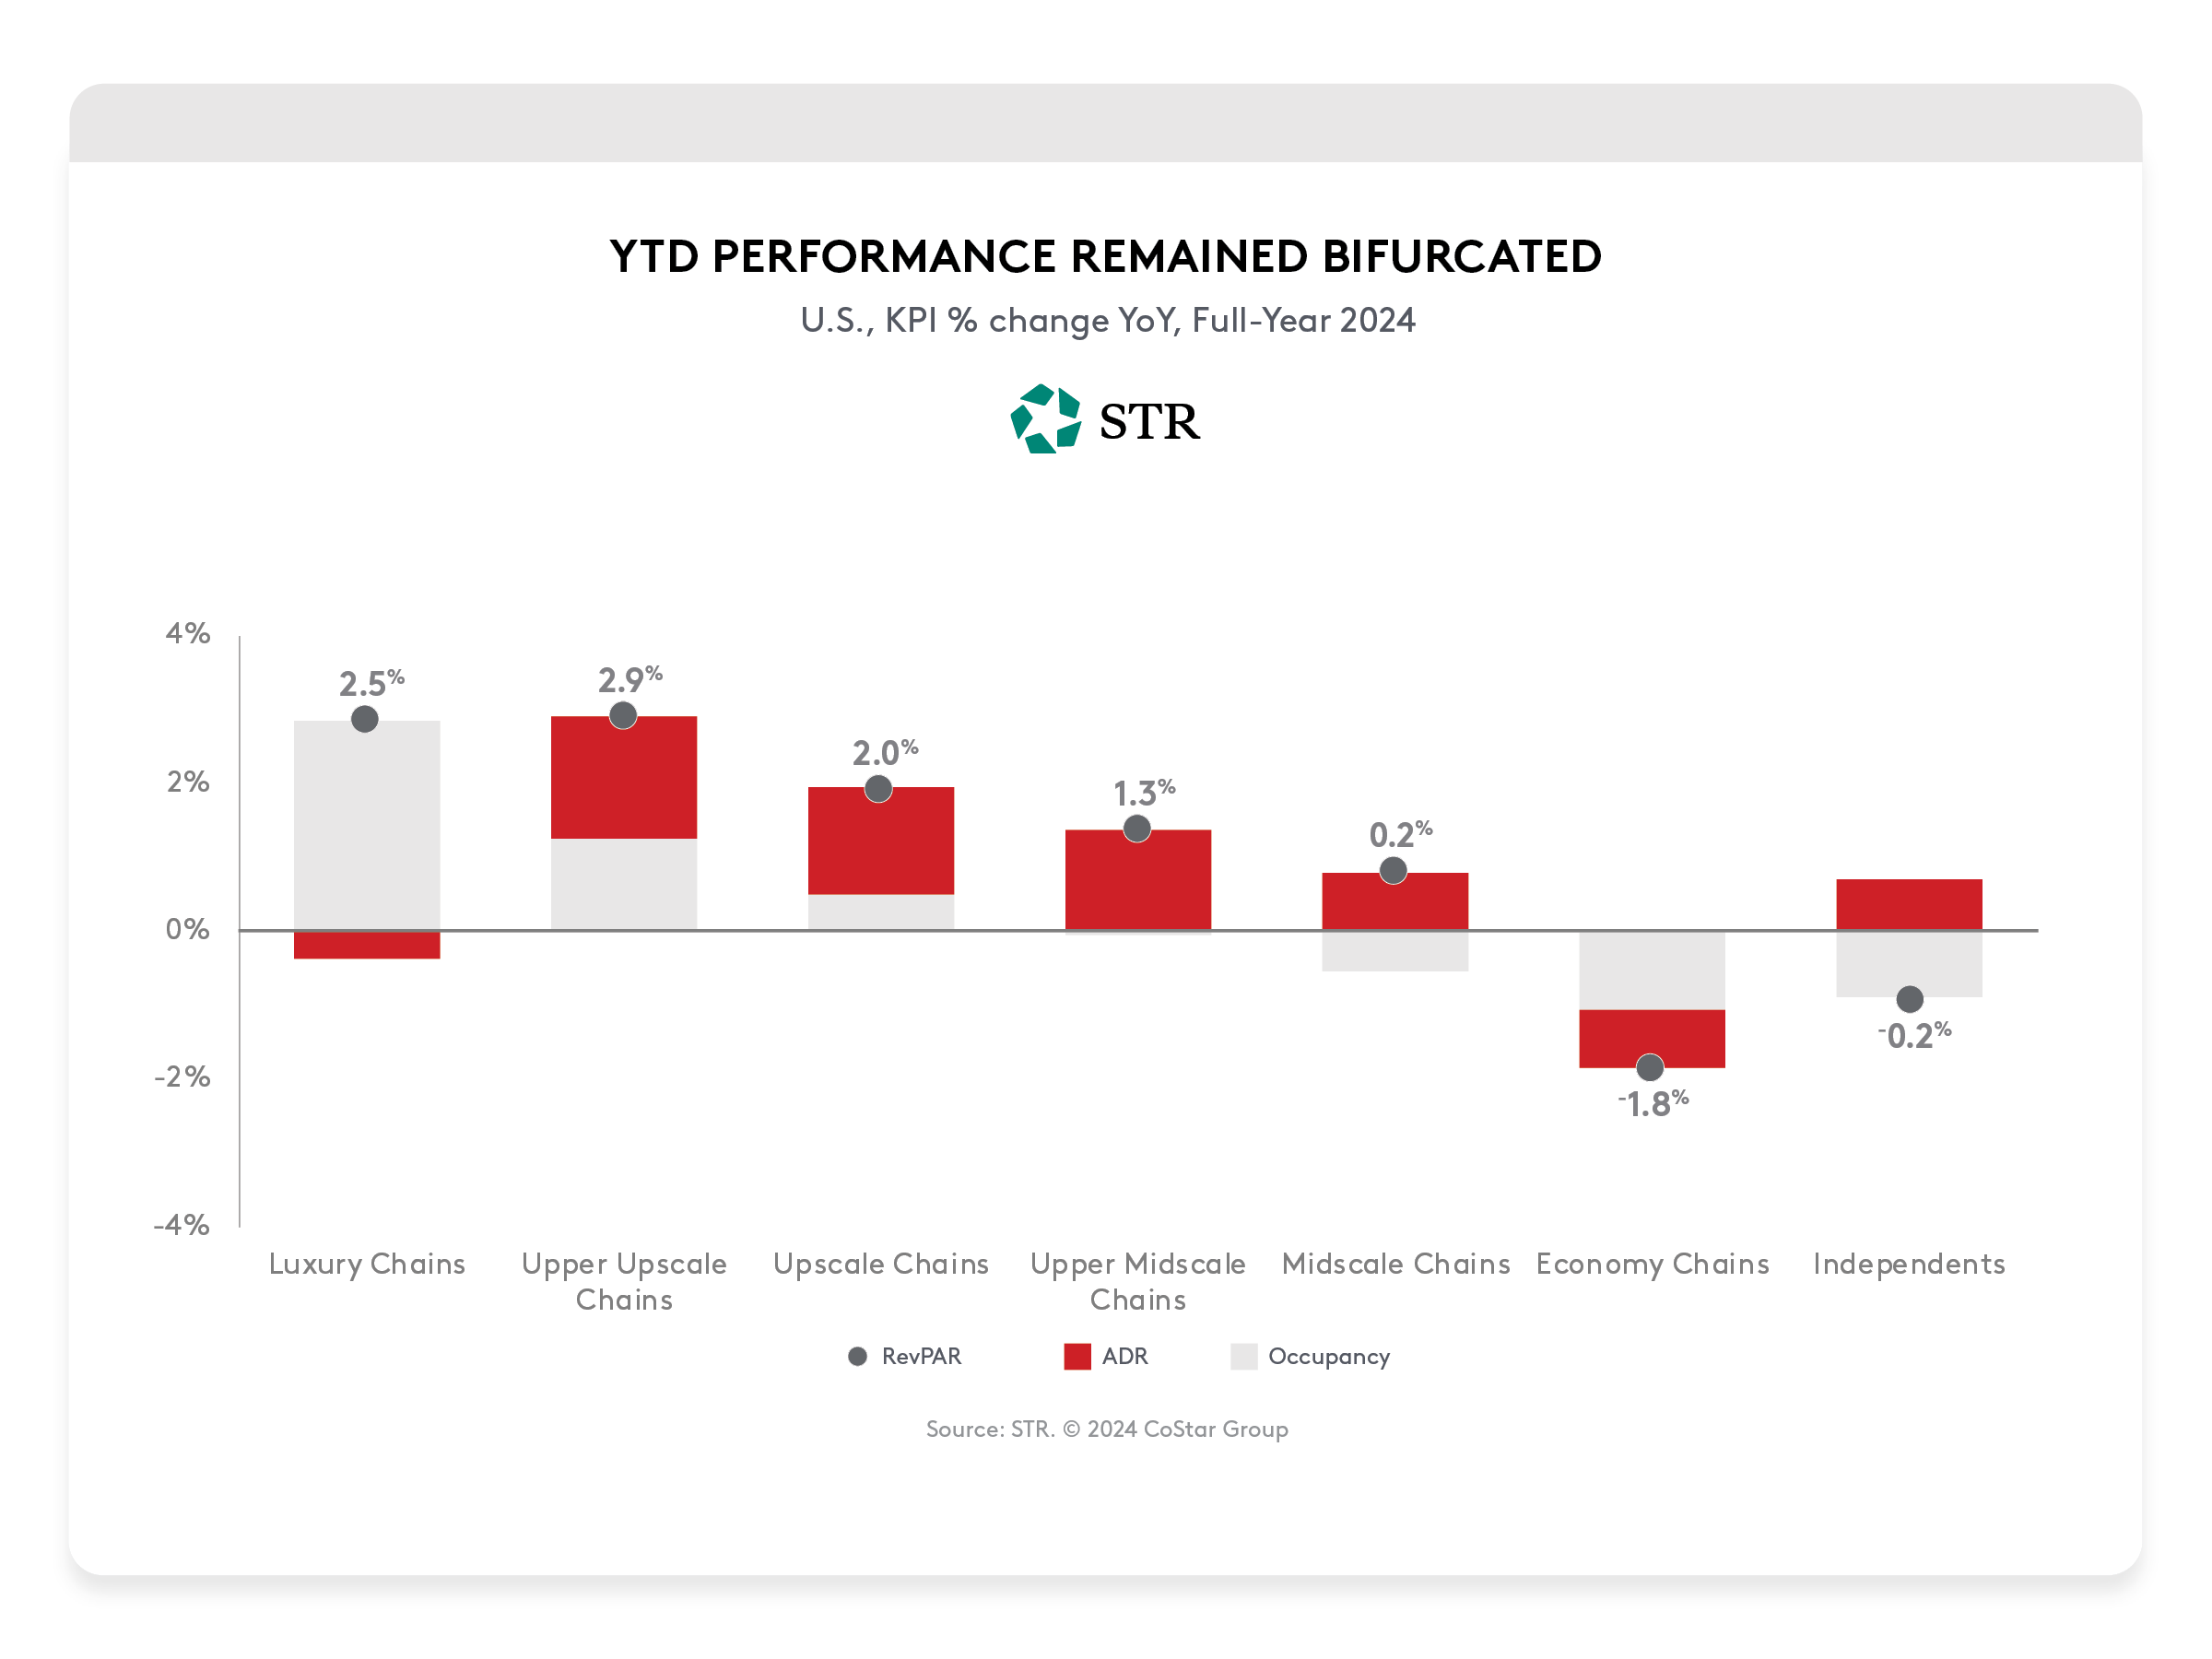
Chain Scales
Hotel performance remained bifurcated most of the year. However, in Q4, the impact of the hurricanes lifted the lower chain scales. This hurricane impact is expected to wane as recovery efforts conclude. For the year, occupancy lifted Luxury RevPAR, while ADR was the primary driver of RevPAR in the middle four chain scales. Both ADR and occupancy declines are pushing Economy hotel chain RevPAR down.
Segmentation
Group and Transient demand in Luxury and Upper Upscale hotels remains strong, increasing 2.9% and 2%, respectively, for the year. During the quarter, October Group demand was driven by the calendar shift of the Jewish observances. November’s Group business slowed due to the election and the Thanksgiving calendar shift, while December saw strong Group demand due to the compressed period between the holidays. Group had the upper hand in ADR (+3.5%) while Transient ADR was flat after significant gains last year.
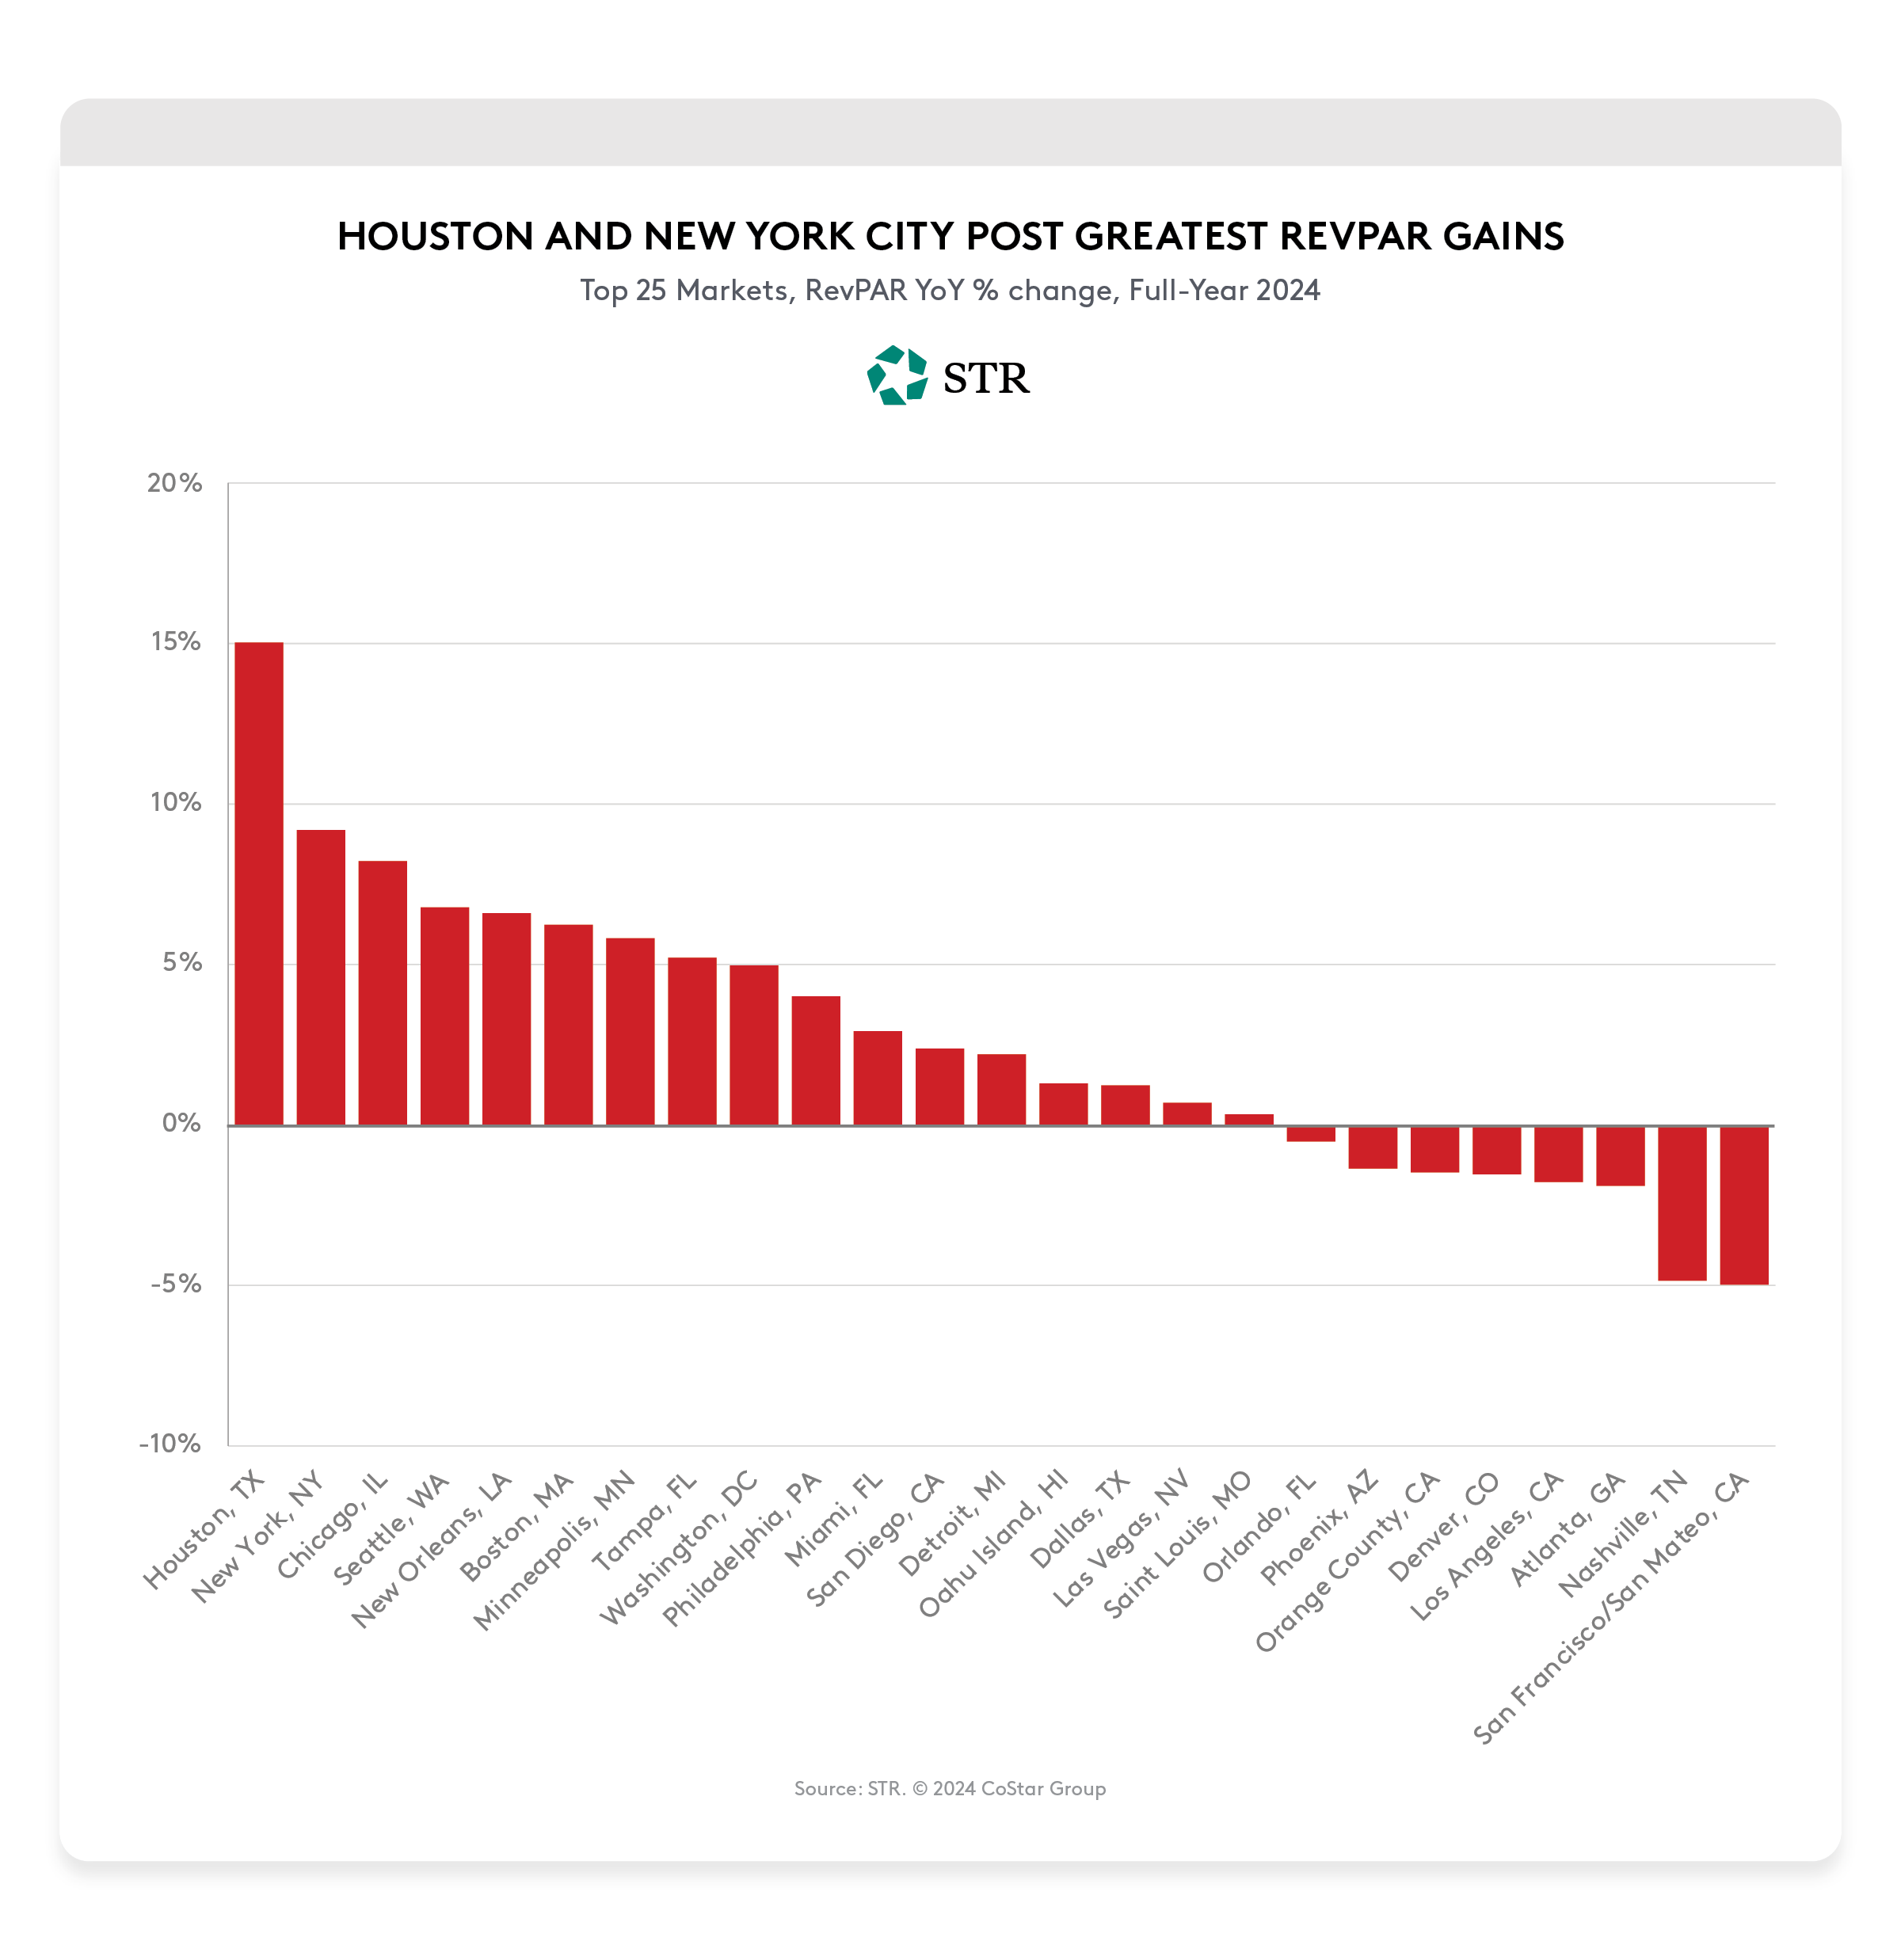
Top 25 Markets YTD
Q4 RevPAR percentage changes in the major markets varied by over 45 points from +34.3% in Tampa to -10% in San Francisco. Again, hurricane recovery, events and calendar shifts had the most impact. For the year, Houston and New York City saw the greatest RevPAR gains. The variance across market gains decreased to 20 points compared to 25 points in 2023, which indicates a return to more normal patterns.
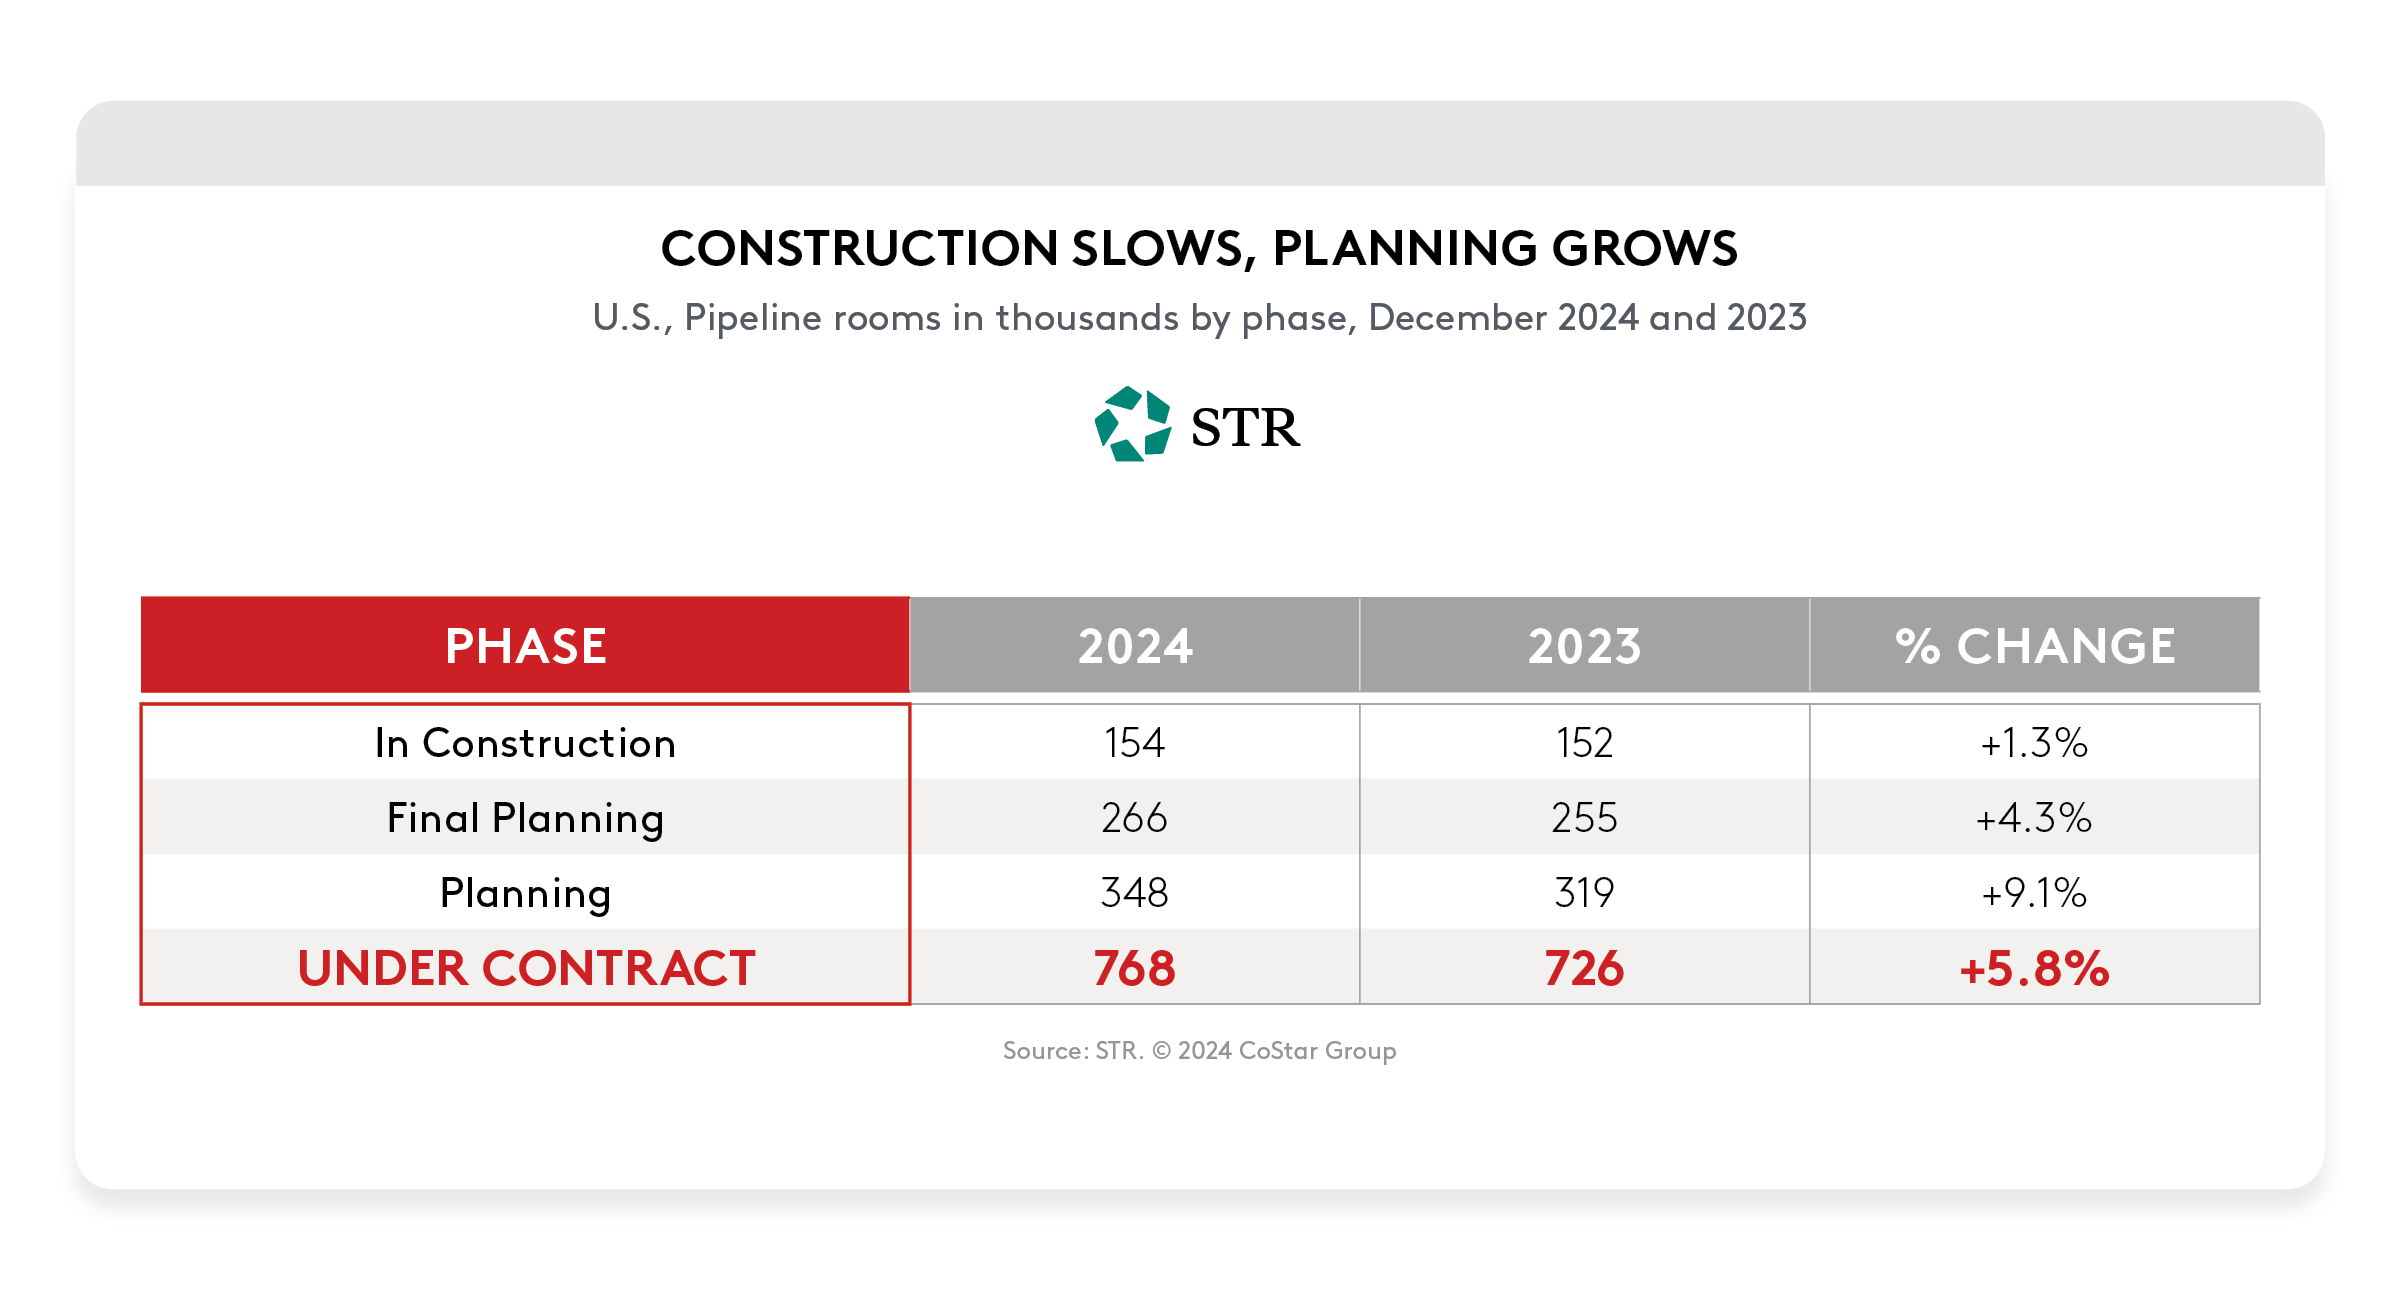
Pipeline
The number of rooms under construction increased YoY in December after a decline in November. Activity in final planning (+4.3%) and planning (+9.1%) softened.
Looking to invest in hotel properties? Don't miss our special auction on March 24-26
From March 24-26, we're holding our first-ever all-hospitality auction event.
Visit LoopNet to see the full selection of hotel properties!